
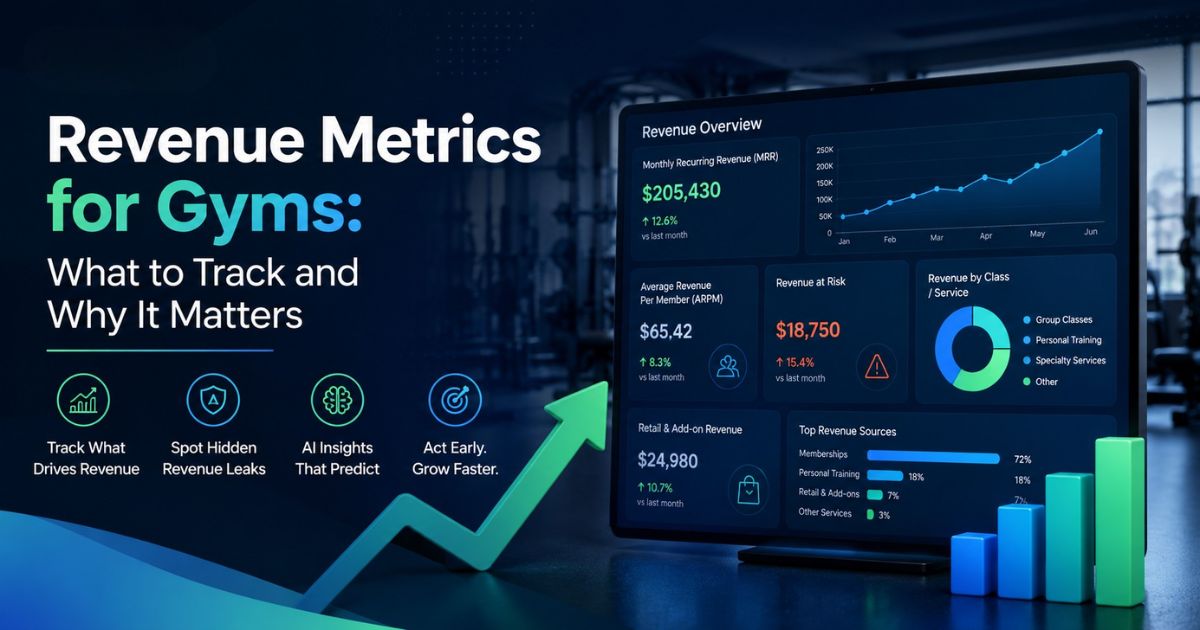
Revenue Metrics for Gyms: What to Track and Why It Matters
Revenue metrics tell you more than how much money came in last month. They tell you where it came from, whether it's likely to keep coming, and where you're quietly leaving money on the table.
Most gym and wellness business owners check one number: total revenue. It feels reassuring when it's flat or rising. But total revenue is a lagging indicator — it shows what already happened, not what's about to happen.
This article breaks down the revenue metrics worth tracking, where hidden leaks usually form, and how AI Business Intelligence turns revenue data into a growth signal instead of a monthly report.
The Core Revenue Metrics to Track
Total revenue on its own hides more than it reveals. These five metrics show the full picture:
- Monthly Recurring Revenue (MRR) — predictable revenue from active memberships each month
- Average Revenue Per Member (ARPM) — total revenue divided by active members
- Revenue at risk — revenue tied to members showing early signs of disengagement, before they formally cancel
- Revenue by class, service, or session — which offerings actually generate income, and which run at a loss
- Retail and add-on revenue — income from products, packages, and services outside core memberships
Together, these metrics separate businesses that are genuinely growing from businesses that just look busy.
Why Total Revenue Isn't Enough
Total revenue can rise while your business is quietly losing ground.
- It can stay flat or climb even as renewal rates decline
- New sign-ups can mask a steady drip of cancellations
- It says nothing about which classes, services, or branches actually drive the number
- By the time total revenue drops, the underlying problem has usually existed for months
A business watching only total revenue finds out about a problem after it's already expensive to fix.
Revenue Opportunities Hiding in Your Data
Revenue Intelligence isn't only about finding leaks. Fitzpot's Opportunity Detection Engine identifies revenue gaps, new program demand, and opportunities for additional services.
Combined with membership behavior, attendance, pricing, and service data, this helps owners identify where growth may exist before relying on guesswork. Instead of waiting for a member to ask about personal training or a new class format, the system surfaces the demand signal first — so you can act before the opportunity is missed.
This shifts revenue tracking from a defensive exercise into an active growth tool.
What Causes Hidden Revenue Leaks
Revenue leaks rarely show up as a single obvious event. They build quietly:
- Members who stop attending long before they formally cancel
- Half-empty classes that still cost full staff and space
- Failed payments that go unnoticed or aren't followed up quickly
- Underperforming branches or time slots dragging down an otherwise healthy average
An AI dashboard with anomaly detection catches these patterns as they form, not months later when they've already shown up as a revenue drop.
How AI Business Intelligence Powers Revenue Tracking
Fitzpot's AI Business Intelligence and Predictive Analytics bring billing, booking, membership and business performance data together to surface actionable revenue insights. Instead of reporting historical numbers once a month, the system:
- Forecasts revenue 30–90 days out based on current trends
- Flags revenue at risk before it hits the books, using engagement and attendance signals
- Surfaces new opportunities through the Opportunity Detection Engine
- Tracks staff performance and utilization alongside revenue, so a booked-out trainer or an underused therapist both show up in the same view
- Feeds everything into a single Analytics Dashboard, covering MRR, ARPM, revenue by class or service, retail performance, and branch comparison in one place
This turns revenue tracking from a static report into a system that flags problems and opportunities as they happen.
What a Unified Revenue View Looks Like
Most gyms track revenue across several disconnected tools. Billing software shows payments. A separate booking system shows attendance. Spreadsheets try to tie it together — usually too late.
A modern AI-powered platform pulls all of this into one place. Membership status, attendance, bookings, retail sales, and payment health sit side by side, not in separate tabs.
This matters because revenue problems rarely have one cause. A dip in ARPM might trace back to fewer add-on sales, a slow class, or a handful of failed payments. Without a unified view, spotting the real cause takes hours of cross-checking. With one, the pattern is visible immediately.
Fitzpot brings this together through its Analytics Dashboard, so revenue, membership, and performance data are read as one connected story instead of separate reports.
How Often Should Revenue Metrics Be Reviewed?
Weekly, not just monthly or quarterly. Metrics like MRR and ARPM shift gradually. Catching a small dip early — through a live dashboard rather than a quarterly spreadsheet — makes it far easier to course-correct before it compounds.
A monthly review only tells you what already happened. A weekly one gives you time to act.
The Bottom Line
Revenue metrics turn a single lagging number into a real-time picture of business health. They show where money is coming from, where it's quietly leaking, and where the next opportunity is hiding in plain sight.
Fitzpot helps businesses bring revenue, membership, booking and performance data into one intelligent view — so revenue tracking stops being a monthly look-back and starts being a live growth tool.